CSF Basics
CSF production, flow, outflow, constitution
The cerebrospinal fluid is constantly formed by active water secretion in the plexus. The normally transparent fluid is practically cell-free and has a low protein content, only the salt content is similar to that of blood. The composition of the cerebrospinal fluid is the sum of all molecules that diffuse in from the blood and the cellular environment of the ventricles or pass through the barriers by facilitated and active transport. The concentration of molecules in the CSF changes constantly along the flow path through the subarachnoid space. The main outflow into the venous blood is unfiltered via the arachnoid villi and along the spinal nerve roots. The rostro-caudal flow is caused by the arterial-venous pressure gradient and active production in the plexus.
References
Reiber H (2024) Cerebrospinal fluid Diagnostics in Neurology. Paradigm change in Brain Barriers, Immune System and Chronic Diseases. Springer, ISBN 978-3-662-68839-7
Reiber H (2023). Liquordiagnostik in der Neurologie. Paradigmenwechsel bei Hirnschranken, Immunsystem und chronischen Krankheiten. Springer, Berlin, ISBN 978-3-662-68136-7, ISBN 3-662-68136-6
Reiber H, Uhr M (2020). Physiologie des Liquors. In: Berlit P. (Hrsg) Klinische Neurologie. Springer, Berlin, Heidelberg. S.107-125
Uhr M, Reiber H (2020). Liquordiagnostik. In : Berlit P (Hrsg) Klinische Neurologie, Springer 2020, S.213-244
Reiber H (2016). Cerebrospinal fluid data compilation and knowledge-based interpretation of bacterial, viral, parasitic, oncological, chronic inflammatory and demyelinating diseases: Diagnostic patterns not to be missed in Neurology and Psychiatry. Arq Neuropsiquiatr. 74:337-350
Reiber H (2016). Knowledge-base for interpretation of Cerebrospinal fluid data patterns – Essentials in Neurology and Psychiatry. Arq Neuropsiquiatr. 74:501-512
Wildemann B, Oschmann P, Reiber H (2010) Laboratory diagnosis in Neurology Thieme Verlag, Stuttgart.
Reiber H (2003). Proteins in cerebrospinal fluid and blood: Barriers, CSF flow rate and source-related dynamics. Restorative Neurology and Neuroscience 21:79-96.
CSF Tutor App, 2024 (www.albaum.it) or CSF-App (apple store)
Brain barrier function
Barriers
The compartmentation in the organism, from the organ to the individual cell, is an important function for the maintenance of special functions that are distinct from the environment. The cell membrane is the oldest form of barrier. The endothelial cell layers of the blood vessel walls are another form of barrier function. They supply the various organs with the organ-specific requirements of oxygen, energy and molecules.
The brain, with its particularly specialized functions and metabolic conditions, needs much more than other organs a complex barrier to the blood, the blood-brain barrier, which influences the exchange of substances between blood and extracellular fluid. 600 kilometres of capillaries with a surface area of 12-18 m2 supply the brain with molecules originating from the blood. The brain, which floats in the cerebrospinal fluid, has another border function, the blood-cerebrospinal fluid barrier. The cerebrospinal fluid, as a compartment between the meninges arachnoid and pia mater, receives molecules from the neighbouring blood vessels and capillaries as well as from the brain cells and transports them back into the venous blood as bulk flow.
Proteins pass through the intercellular space of the endothelial cell layer by diffusion and, depending on the size of the molecule, may in the cerebrospinal fluid only have a thousandth of the blood concentration. Other molecules such as amino acids or glucose enter the CSF space transcellularly through facilitated or energy-dependent active transport and can therefore have a higher concentration in the CSF than in the blood, such as vitamin C, for example.
In addition to diffusion into the cerebrospinal fluid space, cerebrospinal fluid outflow also plays a role in the concentration of molecules in the cerebrospinal fluid. We speak of a steady state of the molecule concentration in normal CSF. In the following, we primarily consider the blood-brain barrier function for proteins and thus only consider passive diffusion as a transfer mechanism.
Barrier structures
The endothelium-associated structures of the brain capillaries appear to be of great variety. Each area, whether plexus or circumventricular organs, trabeculae of the meninges or the brain parenchyma, has a different structure of the blood-brain or blood-cerebrospinal fluid barriers. In many places, the barriers to the cerebrospinal fluid space consist of two cell layers of different density, such as the endothelium/epithelium pair in the ventricle. In the choroid plexus, the proteins first pass through the fenestrated capillary walls (see CSF production) before they are more strongly hindered by the “denser” epithelial cell layer associated with tight junctions. The situation is reversed in the rest of the ventricular surface with a dense capillary endothelium and less dense ependymal layers (gap junctions). This double structure is also found in the circumventricular organs (CVO) with fenestrated capillaries but a dense ependymal cell layer.
The blood-brain barrier function or blood-cerebrospinal fluid barrier function are not to be understood as morphological units but at best as functional units!
The blood-cerebrospinal fluid barrier function for proteins can be described by a diffusion/cerebrospinal fluid flow model. For the blood-brain barrier function this is a corresponding model of diffusion/extracellular flow.
The Blood-Brain Barrier dysfunction and Blood-CSF Barrier dysfunction
The barrier dysfunction observed in many neurological diseases is, contrary to common assumptions, not a leak in the morphological barrier structure. This is apparently plausible for most neuroscientists to this day, but is as wrong as the expectation that a stone thrown into a lake will leave a hole in the water.
The causes of a blood-CSF barrier dysfunction are essentially:
- Reduction of the CSF production rate in the plexus
- Blockage of the CSF flow pathway (stenosis, tumour)
- Blockage of the outflow into the venous blood (sticking meninges, swelling at the spinal roots)
Correspondingly in a Blood-Brain barrier dysfunction, a reduced flow can be induced by a local inflammation (Plaques in Multiple Sclerosis).
Perspectives
Without a paradigm change in the understanding of barrier functions, the observations of barrier dysfunctions remain without rational explanation and escape the possibility of therapy.
For example: The initial increase in proteins in the CSF (QAlb in the figures) observed in most CNS infections is caused by a cytokine-associated interference in the plexus with a reduction in water secretion. This leads to a reduction in CSF production rate with a slowing of the CSF flow and an increase in protein concentrations from the blood, as the steady state is shifted by less outflow.
References
Reiber H (2024) Cerebrospinal fluid Diagnostics in Neurology. Paradigm change in Brain Barriers, Immune System and Chronic Diseases. Springer, ISBN 978-3-662-68839-7
Reiber H (2021a). Blood-CSF barrier dysfunction means reduced cerebrospinal fluid flow not barrier leakage: Conclusions from CSF protein data. Arq Neuropsiquiatr. 79: 56-67
Reiber H (2021b) Non-linear ventriculo – lumbar protein gradients validate the diffusion-flow model for the blood-CSF barrier. Clin Chim Acta. 513: 64-67
Reiber H (1994). Flow rate of cerebrospinal fluid (CSF)- a concept common to normal blood-CSF barrier function and to dysfunction in neurological diseases. J Neurol Sci 122:189-203
Reiber H (1994). The hyperbolic function: a mathematical solution of the protein flux/CSF flow model for blood-CSF barrier function J Neurol Sci 126:243-245.
Reiber H, Ruff M, Uhr M (1993). Ascorbate Concentration in Human Cerebrospinal Fluid (CSF) and Serum. Intrathecal Accumulation and CSF flow rate. Clin Chim Acta 217:163-173.
Kruse T, Reiber H and Neuhoff V (1985). Amino acid transport across the human blood-CSF barrier. An evaluation graph for amino acid concentrations in cerebrospinal fluid. J Neurol Sci 70:129-138.
Reiber H (2024). Blut-Liquor-Schrankenfunktion und Liquorfluß. In: Zettl U, Tumani H, Süessmuth S. (Eds). Klinische Liquordiagnostik. Walter de Gruyter, Berlin 2024
Laboratory Methods
1. Survey of relevant analytes and methods
The German CSF society [www.DGLN.de] provides a METHOD CATALOG which contains the most relevant analytes for CSF diagnostics. The analytes are discriminated in three categories:
• Emergency program
• Standard Routine Analysis
• Extended Program
The method catalog gives also the normal reference ranges of the analytes with the corresponding literature.
2. CSF Laboratory Practice
Actual laboratory courses are announced on the website of the CSF Society ( www.DGLN.de), and the Institute for external quality control (www.INSTAND-ev.de).
The manual of the probably most visited multi-day laboratory course by H. Reiber, which was based on the experience in the neurochemical laboratory in Göttingen, is offered here for download. Principles of the basic analytical methods are described by H. Reiber in: Wildemann B, et al (2010).The most actual and competent description of practical Cytology in CSF is published by Kluge et al. A practical laboratory handbook was updated by Zimmermann et al.
References
Ausgewählte Methoden der Liquordiagnostik und Klinischen Neurochemie (2020). INSTAND Schriftenreihe Bd II ISBN 978-3-98217-810-3 or www, dgln.de for download
Reiber, H. CSF Laboratory course- Manual. 2020, Download.
Wildemann B, Oschmann P, Reiber H. (Eds). Laboratory diagnosis in Neurology, Thieme, Stuttgart, 2010
Uhr M, Reiber H. Liquordiagnostik. In : Berlit P (Hrsg) Klinische Neurologie, Springer 2020, S.213-244
Reiber, H.: Knowledge-base for interpretation of Cerebrospinal fluid data patterns – Essentials in Neurology and Psychiatry. Arq Neuropsiquiatr 2016;74(6):501-512
Reiber H. Software for cerebrospinal fluid diagnostics and statistics. Revista cubana de investigaciones Biomedicas. 2020;39 (3):e740 http://scielo.sld.cu/scielo.php?pid=S0864-03002020000300004&script=sci_arttext&tlng=es
Kluge H, , Wieczorek V, Linke E, Zimmermann K, Witte OW. Atlas der praktischen Liquorzytologie, 2005 Thieme
Zimmermann K, Kühn HJ, Linke E. Praktische Liquordiagnostik in Frage und Antwort. INSTAND eV, Düsseldorf, 3rd Ed, 2024 (2nd English ed. 2013, INSTAND)
Interpretations /Reibergrams
Data interpretation in CSF diagnostics has a particular quality in clinical chemistry. By functionally combining the data, disease-typical patterns of pathological analyte values can be recognized (see CSF data report).
The Interpretation of Protein Data in CSF are a main goal in CSF Diagnostics. We have to consider source related differences for
• Blood-derived proteins
• Brain cell-derived proteins
• Leptomeningeal Proteins
One of the sub-areas is the recognition of pathological intrathecal immunoglobulin patterns. The combined IgG-. IgA-, IgM- quotient diagrams with empirically and theoretically based reference ranges (Reiber diagram or Reibergram) were developed for this purpose. A free tutorial App is available to learn about these immunoglobulin patterns. This approach replaces the earlier linear interpretation concepts like IgG Index or Tourtellottes formula (H.Reiber and J. Peter).
References
Reiber H and Peter JB (2001) Cerebrospinal fluid analysis – disease-related data patterns and evaluation programs. J Neurol Sci;184:101-122.
Reiber H (1994). Flow rate of cerebrospinal fluid (CSF)- a concept common to normal blood-CSF barrier function and to dysfunction in neurological diseases. J Neurol Sci 122:189-203.
Reiber H (1994). The hyperbolic function: a mathematical solution of the protein flux/CSF flow model for blood-CSF barrier function J Neurol Sci 126:243-245.
Blood derived proteins
All blood proteins are found in CSF with concentrations according to their molecular size, evtl. as low as 1/3300 of the blood concentration for IgM.
The CSF concentration is calculated as CSF/serum quotient to represent a normalized, dimensionless concentration, independent of the variations in blood.
The CSF concentrations of the blood proteins are a steady state between influx (molecular flux) and elimination by CSF flow rate (bulk flow). The flow rate changes individually and due to barrier dysfunctions. The CSF concentration (QIgG, etc) is evaluated by the reference to the albumin quotient QAlb with a nonlinear hyperbolic reference line in quotient diagrams or numerically defined as Qlim (Fig.)
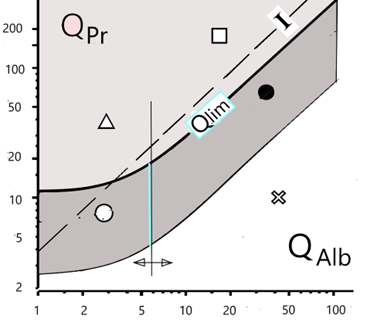
Fig.:The CSF/serum quotient diagram for proteins, QPr.
Qlim is the hyperbolic borderline between a protein fraction originating from the blood (dark area) and a fraction of this protein synthesized in the brain (lighter area above) with five areas of interpretation. The reference protein is albumin (QAlb) derived exclusively from the blood with a vertical borderline between normal and barrier dysfunction. The dashed line represents the previously used index I = QPr/QAlb, mostly used as numerical, linear limit value.
Reibergrams
Based on the quotient diagram (QIgG/QAlb) introduced 60 years ago by Ganrot and Laurell, the reference ranges between immunoglobulins derived from the blood and from intrathecal synthesis have been described by H. Reiber in a series of developments since 1978. The hyperbolic function was first described in 1987 as a limit line (Qlim in the above quotient diagram) for IgG, IgA and IgM quotient diagrams. In 1994, the empirical and mathematically founded form of the hyperbolic functions of the reference ranges used today was described on the basis of data from 4300 patients.This combination of quotient diagrams for IgG, IgA and IgM are known as Reibergrams, Reiber diagrams, Reibergramma etc. (see Fig).
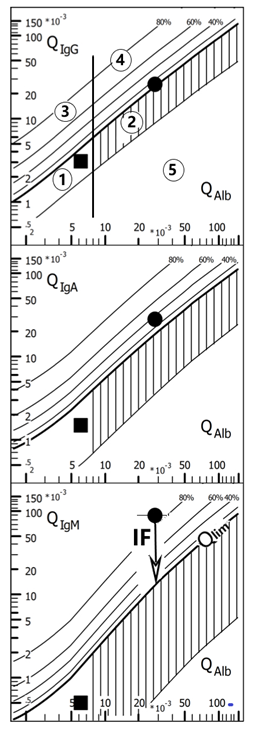
Fig.; Quotient diagrams with hyperbolic reference ranges (Reibergram). The reference ranges of the blood-derived IgG, A, M fractions in the CSF, range 1 (normal) and 2 (barrier dysfunction) comprise 99% (Qmean +/-3CV) of the 4300 patients examined. The intrathecal fractions can be read directly from the graphs with lines for 20, 40, 60 and 80 % intrathecal fractions, with reference to the upper discrimination line (QLim) as 0 % synthesis. The vertical threshold line of the reference range for QAlb between range 1 and 2 is age-dependent. The data in the diagram are from two patients with facial nerve palsy. With IgGIF = 8%, IgAIF = 32%, IgMIF = 85%, the Borrelia-induced facial nerve palsy has a typical three-class reaction with IgM class dominance (IgMIF > IgAIF > IgGIF). (Borrelia-AI (IgG)= 3.1; Borrelia-AI (IgM)= 2.8). The case with normal immunoglobulin and albumin quotients represents a patient with a facial palsy due to a Varicella zoster infection. The proof of the causative microorganism comes from analysis of the corresponding Antibody Index (for more details see CSF App, at www.albaum.it). This diagram is created with the CSF research tool (www.albaum.it).
Disease-related data patterns
This combination of the immunoglobulin response evtl. together with further information, as shown in the integrating CSF data report, allows the detection of disease related data pattern. The pattern may point to an unexpected disease (neurotuberculosis, non Hodgkin lymphoma, etc) or contradict a preliminary suggested diagnosis. Examples are shown in the references below.
A training program with examples and corresponding comments is provided by a free CSF Tutor App from www.albaum.it (CSF-App in the apple store).
References
Reiber H (2016). Cerebrospinal fluid data compilation and knowledge-based interpretation of bacterial, viral, parasitic, oncological, chronic inflammatory and demyelinating diseases: Diagnostic patterns not to be missed in Neurology and Psychiatry. Arq Neuropsiquiatr. 74:337-350
https://www.scielo.br/j/anp/a/nzjMq8tvsWsGcgBDSYzCNsb/?lang=en
Reiber H (2016). Knowledge-base for interpretation of Cerebrospinal fluid data patterns – Essentials in Neurology and Psychiatry. Arq Neuropsiquiatr. 74:501-512
https://www.scielo.br/j/anp/a/HvJBrPySXmzb86JRcZXs8TD/?lang=en
Uhr M, Reiber H (2020). Liquordiagnostik. In : Berlit P (Hrsg) Klinische Neurologie, Springer 2020, S.213-244
Reiber H (1998). Cerebrospinal fluid – physiology, analysis and interpretation of protein patterns for diagnosis of neurological diseases. Multiple Sclerosis 4:99-107.
Reiber H and Peter JB (2001) Cerebrospinal fluid analysis – disease-related data patterns and evaluation programs. J Neurol Sci; 184:101-122.
Korenke GC, Reiber H, Hunnemann DH, Hanefeld F. (1997). Intrathecal IgA synthesis in X-linked cerebral adrenoleukodystrophy. J Child Neurol 12(5):314-320
CSF Tutor App, 2024 (www.albaum.it) or CSF-App (apple store)
Brain-derived proteins
Glial, neuronal or plexus cells release proteins into extracellular and cerebrospinal fluids.
In this case the Interpretation of absolute concentration values is relevant, as the CSF concentrations don’t depend on the blood concentrations and the lumbar concentrations are invariant to the CSF flow rate.
Leptomeningeal proteins
Due to the steady release of proteins from the leptomeningeal cells (beta trce protein, cystatin, etc.) their lumbar concentrations depend linearly on the CSF flow rate. The interpretation of absolute concentrations must therefore refer to QAlb.
References
Reiber H (2003). Proteins in cerebrospinal fluid and blood: Barriers, CSF flow rate and source-related dynamics. Restorative Neurology and Neuroscience 21:79-96.
Cumulative CSF Data Report
CSF diagnostics is characterized by the biologically relevant compilation of analytes in order to obtain disease-related data patterns, providing improved medical interpretations. A medically relevant combination of data are part of improved diagnostic quality and reliability. The development perspectives in clinical chemistry and laboratory medicine point away from mega-automated systems with a constantly growing number of individual analytes towards the interpretation of disease-related data patterns.
The Example of the CSF data report integrates the laboratory investigations in a manner that allow the neurologist to recognise disease related, typical patterns. It also can integrate the clinical neurochemist into the diagnostic process, if a good clinical question is provided with the analysis request. Above all, the laboratory is enabled to recognise analysis problems by inconsistent data combinations. But: Knowledge-based data combinations are an aid to interpretation, but can never lead to a diagnosis on their own, which ultimately always has to be made by the doctor in the clinical context.
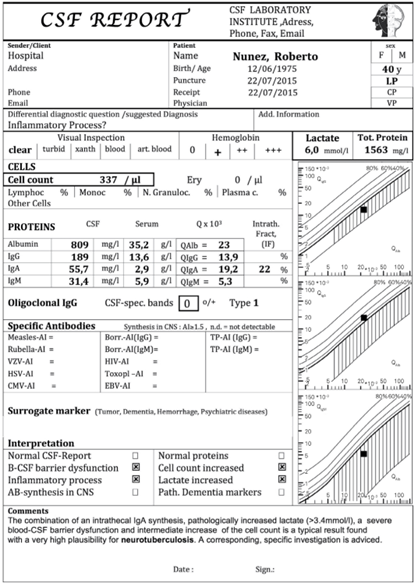
Fig.: Cumulative CSF Data Report. Example from a patient with Neurotuberculosis with isolated intrathecal IgA synthesis, serious barrier dysfunction and increased cell cont in CSF. The increased lactate in CSF together with a dominant intrathecal IgA synthesis are characteristic to point to this often unexpected diseases
Chronic diseases/ Immune networks
In the context of the global Covid epidemy, the problems of dealing with chronic, pathogen-associated diseases have been brought to public attention as never before.Delayed symptoms such as chronic fatigue syndrome/myalgic encephalomyelitis or the increased occurrence of Guillain Barré syndrome after infection or even after vaccination against the corona virus have also been brought to political and scientific attention due to their increased occurrence.
Autoimmune diseases are becoming increasingly diagnosable through the detection of autoantibodies. However, there are hardly any convincing models for their development. In chronic diseases such as multiple sclerosis, the polyspecific antibody reactions (MRZ reaction) that occur without a causal relationship have been known for a long time. However, the fact that even in HSV encephalitis on average 90% of the antibodies synthesised in the brain are not specific HSV antibodies but polyspecific antibody reactions is less recognised. These observations of immune system-associated pathologies can only be interpreted with an understanding of the immunological network. However, this requires a paradigm shift in immunology, especially in neuroimmunology, in which the local reactions of trans-organ cytokine networks play a role.
In addition to the connections with the complex systems, which are not discussed further here, the antibody reactions of the immune system-associated pathologies play an important diagnostic role.
In the references cited, three different forms of disease are essentially discussed with regard to diagnosis and therapy:
- Persistent causative microorganism. These include, for example, rubella-induced Fuchs hetrochromic cyclitis of the eye or measles-dependent subacute sclerosing panencephalitis.
- Immune reactions without a specific antigen. These include, for example, autoimmune reactions or Gulf was illness.
- Immune system associated pathologies without a humoral immune reaction. These include, for example, some psychiatric diseases with barrier dysfunction and neopterin or cytokine increases in the cerebrospinal fluid. No intrathecal antibodies or general immunoglobulin syntheses are observed. The initial disturbance of the plexus, associated with cytokines in inflammatory processes, can explain the barrier dysfunction as an immune system-associated symptom by disturbing water secretion in the plexus with slowed cerebrospinal fluid flow.
References
Reiber H (2024) Cerebrospinal fluid Diagnostics in Neurology. Paradigm change in Brain Barriers, Immune System and Chronic Diseases. Springer, ISBN 978-3-662-68839-7
Reiber H (2023). Liquordiagnostik in der Neurologie. Paradigmenwechsel bei Hirnschranken, Immunsystem und chronischen Krankheiten. Springer, Berlin, ISBN 978-3-662-68136-7, ISBN 3-662-68136-6
Bechter K (2020). The challenge of assessing mild Neuroinflammation in severe mental disorders. Frontiers in Psychiatrie. 11, 773
Reiber H (2017a). Chronic diseases with delayed onset after vaccinations and infections: A complex systems approach to pathology and therapy, J Arch Mil Med. 2017 ;5(3): e12285. doi: 10.5812/jamm.12285.
Reiber H (2017b). Polyspecific antibodies without persisting antigen in multiple sclerosis, neurolupus and Guillain-Barré syndrome: immune network connectivity in chronic diseases. Arq Neuropsiquiatr 2017, 75(8):580-588, doi.org/10.1590/0004-282X20170081
Reiber H, Ungefehr St, Jacobi Chr (1998). The intrathecal, polyspecific and oligoclonal immune response in multiple sclerosis. Multiple Sclerosis 4:111-117.
Reiber H (2012). Epigenesis and epigenetics- understanding chronic diseases as a selforganizing stable phenotype Neurol. Psych. Brain Res. 18: 79-81
National Academies of Sciences, Engineering and Medicine (2016). Gulf War and health. Update of health effects in the Gulf War. Washington DC: The National Academies Press; (10).
Reiber H, Davey B (1996). Desert-storm-syndrome and immunization. Arch Internal Med 156:217.
Terryberry J, et al. (1995). Myelin- and microbe-specific antibodies in Guillain-Barre syndrome. J Clin Lab Anal. 9:308–19.
Graef IT, Henze T und Reiber H (1994). Polyspezifische Immunreaktion im ZNS bei Auto-immunerkrankungen mit ZNS-Beteiligung. Zeitschrift für ärztl Fortbildung 88:587-591
Aqueous humor (AH) of the eye
Analogous structures of both compartments, the CSF space and the AH space, with similar barrier functions and flow dynamics are ideal physiological conditions for the application of the data interpretation concepts from CSF data for the AH data interpretation. As shown, the Quotiont diagram for IgG in CSF (Reibergram) can be used for the interpretation of the IgG in AH. Also the reference value for the Albumin quotient in AH is the same as for QAlb in CSF. The most frequent analytical request in AH analysis is the detection of Antibodies. The very common interpretation by the linear Goldman Witmer Index (GWI) can be improved by the corrected Antibody Index with reference to the nonlinear reference Qlim.
The references show examples for the three basic differential diagnostic questions
- Antigen specific antibodies in acute disease (toxoplasmosis)
- Antigen-specific antibodies in chronic disease (rubella in Fuchs’ Heterochromic Cyclitis)
- Polyspecific antibodies (M, R Z reaction) in multiple scleosis
Methods
The small volume of AH extracted from eye (50µl-100µl) need particular care for analysis in the routine laboratory.
For protein analysis, albumin and IgG in aqueous humor and serum were analyzed with immunochemical nephelometry. To match the requested volume for routine analysis aqueous humor samples need a manual predilution with 0.9% NaCl (1:2–1:10, depending on total protein concentration).
Corrected Antibody Index
Antibody analysis is performed on commercial microtiter plates as described for CSF. The samples of aqueous humor (1:15 dilution) and serum (1:3,000 dilution) are analyzed paired in the same analytical run. The measured optical density was evaluated as arbitrary concentration units (AU), by reference to a standard curve. After multiplication with the dilution factor, we calculate with the aqueous humor and serum antibody concentrations the specific antibody quotient, Qspec = AU(aqueous humor)/AU(ser). The AI is calculated either with AI = Qspec/QIgG if QIgG <QLim, or AI = Qspec/QLim if QIgG >QLim (in the Figure). Reference range is for normal AI ≤ 1.4
An example is calculated from a patient in the figure with QIgG =24 x10-3 and QAlb = 12 x 10-3, the corresponding upper limit of the reference range (QLim = 9.7 x10⁻³) and the intraocular fraction (IgGIF = 60%). With the specific rubella- Quotient (rubella-Qspec = 16.5 x10- 3 ) for this patient, we get the (corrected) Antibody Index (AI) with AI = Qspec/QLim = 16.5/9.7 = 1.7, a pathologic value. The Goldman-Witmer Index (GW-I = 16.5/24 = 0.7) would give a false negative interpretation.
Intraocular IgG Synthesis
The Figure shows data from a group of MS patients with an intraocular inflammation of the eye (periphlebitis or uveitis observed in about 10 % of all MS patients). The inflammations of the inner eye present an immune response in aqueous humor, different from the optic neuritis, a retro bulbar inflammation, where an immune reaction can be detected in CSF but not in AH. A basic difference appaers in pathological conditions where the larger QAlb values can be explained by a flow rate restriction of AH which is much stronger than for CSF.
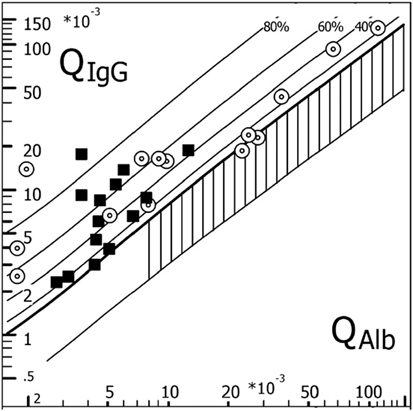
Figure: Corresponding CSF data (filled squares) and AH data (circles) for intrathecal and intraocular IgG synthesis and barrier functions from N = 14 individual MS patients. QIgG (CSF and AH) is shown as a function of the patients QAlb (CSF or AH) in an IgG CSF/serum quotient diagram (Reibergram). The largest albumin AH/serum quotients, QAlb, are from patients with an anterior uveitis and the smallest from patients with periphlebitis retinae. All patients had oligoclonal IgG in AH and CSF. This diagram is created with the CSF research tool (www.albaum.it).
References
Quentin CD, Reiber H (2004). Fuchs´ Heterochromic Cyclitis – rubella virus antibodies and genome in aqueous humor AJO 138:46-54.
Reiber H, Kruse-Sauter, H, Quentin C (2015). Antibody patterns vary arbitrarily between cerebrospinal fluid and aqueous humor of the individual multiple sclerosis patient: Specificity-independent pathological B cell function. J Neuroimmunol; 278: 247-54
Quentin CD, Reiber H (1997). Kammerwasseranalytik bei intraokularer Toxoplasmose. Ophtalmologe, Springer-Verlag 94:728-731.
EQAS – External quality assessment system
The Quality control of the CSF Laboratory performance includes more than control of accuracy and variation of absolute concentrations of the proteins, lactate, glucose and dementia markers. As part of the control in the INSTAND survey the participants have to interprete the combined data in quotient diagrams (IgG, IgA, IgM) and dementia marker combinations. The results of the CSF surveys (Reports of M.Uhr on the INSTAND website) indicate serious deficits in the combined analysis of CSF and serum.
The uge variations of method dependent CSF/serum concentration quotients in the surveys (INSTAND, Düsseldorf) indicate the necessity of serious changes from most assay providers for a better match of the calibrations in their CSF and serum assays. This concept shows that a knowledge based interpretation of data patterns is better than any cost effective accreditation procedure.
References
Reiber H (1995). External quality assessment in clinical neurochemistry: Survey of analysis for cerebrospinal fluid (CSF) proteins based on CSF/serum quotients. Clin Chem 41: 256-263.
Wildemann B, Oschmann P, Reiber H (2010) Laboratory diagnosis in Neurology Thieme Verlag, Stuttgart.
Reiber H (2024) Cerebrospinal fluid Diagnostics in Neurology. Paradigm change in Brain Barriers, Immune System and Chronic Diseases. Springer, ISBN 978-3-662-68839-7
Reiber H (2024) Disease-related data patterns in Cerebrospinal fluid diagnostics. Medical quality versus analytical quantity. Frontiers in Molecular Biosciences
Reiber H (2024) Disease-related data patterns in Cerebrospinal fluid diagnostics. Medical quality versus
analytical quantity. Front. Mol. Biosci. 11:1348091. doi: 10.3389/fmolb.2024.1348091