Cerebrospinal Fluid Diagnostics
CSF Basics
CSF Production, flow, outflow, constitution
The cerebrospinal fluid is constantly formed by active water secretion in the plexus. The normally transparent fluid is practically cell-free, with a low protein content, only the salt content is similar to that of blood. The composition of the cerebrospinal fluid content is the sum of all the molecules diffusing and transported in from the surroundings of the ventricles, released from brain cells, plexus cells and leptomeningal cells. Molecular concentrations in CSF change constantly along the flow path through the subarachnoid space.The main outflow into venous blood is via the arachnoid villi and along the spinal nerve roots. The rostro-caudal flow is driven by the arterial-venous pressure gradient.
References
Reiber H (2024) Cerebrospinal fluid diagnostics in Neurology. Paradigm change in Brain Barriers, Immunology and Chronic Diseases (Springer)
English version: https://link.springer.com/book/9783662688397
German version: https://link.springer.com/book/10.1007/978-3-662-68136-7
Reiber H, Uhr M (2020). Physiologie des Liquors. In: Berlit P. (Hrsg) Klinische Neurologie. Springer, Berlin, Heidelberg. S.107-125
Wildemann B, Oschmann P, Reiber H (2010) Laboratory diagnosis in Neurology Thieme Verlag, Stuttgart.
Reiber H (2003). Proteins in cerebrospinal fluid and blood: Barriers, CSF flow rate and source-related dynamics. Restorative Neurology and Neuroscience 21:79-96. Reiber H (1994). Flow rate of cerebrospinal fluid (CSF)- a concept common to normal blood-CSF barrier function and to dysfunction in neurological diseases. J Neurol Sci 122:189-203
Laboratory Methods
1. Relevant Methods
METHOD CATALOG in [www.DGLN.de] with discrimination of three categories:
Emergency program
Standard Routine Analysis
Extended Program
a) Reiber Laboratory course, CSF MANUAL :
b) Reiber H. Principles of analytical methods. In: Wildemann B, et al (2010)
c) Kluge et al. Cytology. 2005
d) Zimmermann et al., INSTAND, 2013
3. General Publications
Wildemann B, Oschmann P, Reiber H. (Eds). Laboratory diagnosis in Neurology, Thieme, Stuttgart, 2010
Uhr M, Reiber H. Liquordiagnostik. In : Berlit P (Hrsg) Klinische Neurologie, Springer 2020, S.213-244
Reiber, H.: Knowledge-base for interpretation of Cerebrospinal fluid data patterns – Essentials in Neurology and Psychiatry. Arq Neuropsiquiatr 2016;74(6):501-512
Reiber H. Software for cerebrospinal fluid diagnostics and statistics. Revista cubana de investigaciones Biomedicas. 2020;39 (3):e740 http://scielo.sld.cu/scielo.php?pid=S0864-03002020000300004&script=sci_arttext&tlng=es
Kluge H, , Wieczorek V, Linke E, Zimmermann K, Witte OW. Atlas der praktischen Liquorzytologie, 2005 Thieme
Zimmermann K, Kühn HJ, Linke E. Praktische Liquordiagnostik in Frage und Antwort. INSTAND eV, Düsseldorf, 2013
Interpretations/Reibergrams
The Interpretations of Protein Data in CSF are a main goal in CSF Diagnostics
The interpretations have to consider source related differences for
- Blood-derived proteins
- Brain cell-derived proteins
- Leptomeningeal Proteins
Ref.: Reiber H (2003). Proteins in cerebrospinal fluid and blood: Barriers, CSF flow rate and source-related dynamics. Restorative Neurology and Neuroscience 21:79-96.
Blood derived proteins
All blood proteins are found in CSF with concentrations according to their molecular size, evtl. as low as 1/3300 of the blood concentration for IgM.
The CSF concentration is calculated as CSF/serum quotient as normalized , dimensionless concentration, independent of the variations in blood.
The CSF concentrations are a steady state between influx and elimination by CSF flow rate. The flow rate changes individually and due to barrier dysfunctions. The CSF concentration (QigG, etc) is evaluated by the reference to QAlb with a nonlinear hyperbolic reference line in quotient diagrams or numerically defined as Qlim (Fig.)
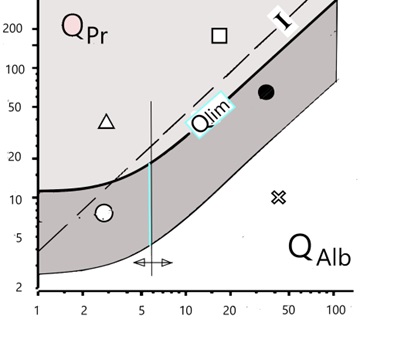
The CSF/serum quotient diagram for proteins, QPr.
Qlim is the hyperbolic borderline between a protein fraction originating from the blood (dark area) and a fraction of this protein synthesised in the brain (lighter area above) with five areas of interpretation. The reference protein is albumin (QAlb) derived exclusively from the blood with a vertical borderline between normal and barrier disorder. The dashed line represents the previously used index I = QPr/QAlb, a mostly numerical, linear limit value.
Reiber H (2024) Cerebrospinal fluid diagnostics in Neurology. Paradigm change in Brain Barriers, Immunology and Chronic Diseases (Springer)
Brain derived proteins
The Interpretation of absolute concentration values is relevant, as the concentrations are invariant to the CSF flow rate.
Leptomeningeal proteins
The interpretation of absolute concentrations as a function of QAlb is necessary as the concentrations are varying with CSF Flow Rate.
Examples in: Reiber H (2003). Proteins in cerebrospinal fluid and blood: Barriers, CSF flow rate and source-related dynamics. Restorative Neurology and Neuroscience 21:79-96.
Reibergrams
The combination of quotient diagrams for IgG, IgA and IgM are known as Reibergrams, Reiber diagrams, Reibergramma etc.
This combination allows the detection of Disease-related data patterns.
A trainings program is provided as CSF Tutor App from:
Ref.:
Reiber H (2016). Cerebrospinal fluid data compilation and knowledge-based interpretation of bacterial, viral, parasitic, oncological, chronic inflammatory and demyelinating diseases: Diagnostic patterns not to be missed in Neurology and Psychiatry. Arq Neuropsiquiatr. 74:337-350
https://www.scielo.br/j/anp/a/nzjMq8tvsWsGcgBDSYzCNsb/?lang=en
Reiber H (2016). Knowledge-base for interpretation of Cerebrospinal fluid data patterns – Essentials in Neurology and Psychiatry. Arq Neuropsiquiatr. 74:501-512
https://www.scielo.br/j/anp/a/HvJBrPySXmzb86JRcZXs8TD/?lang=en
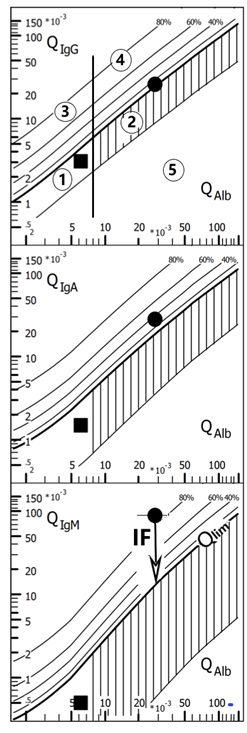
Quotient diagrams with hyperbolic borderlines, Qlim The reference ranges of the blood-derived IgG, A, M fractions in the CSF, range 1 (normal) and 2 (barrier dysfunction) comprise 99% (Qmean +/-3CV) of the 4300 patients examined. The intrathecal fractions can be read directly from the graphs with lines for 20, 40, 60 and 80 % intrathecal synthesis, with reference to the upper discrimination line (QLim) as 0 % synthesis. The threshold of the reference range for QAlb between range 1 and 2 is age-dependent. The data in the diagram are from two patients with facial nerve palsy. With IgGIF = 8%, IgAIF = 32%, IgMIF = 85%, Borrelia-induced facial nerve palsy has a typical three-class reaction with IgM class dominance (IgMIF > IgAIF > IgGIF). (Borrelia-AI (IgG)= 3.1; Borrelia-AI (IgM)= 2.8). (H.Reiber, Springer, 2024)
Cumulative CSF Data Report
CSF diagnostics is characterized by the biologically relevant compilation of analytes in order to obtain disease-related data patterns, providing improved medical interpretations. A medically relevant combination of data are part of improved diagnostic quality and reliability. The development perspectives in clinical chemistry and laboratory medicine point away from mega-automated systems with a constantly growing number of individual analytes towards the interpretation of disease-related data patterns.
The Example of the CSF data report integrates the laboratory investigations in a manner that allow the neurologist to recognise disease related, typical patterns. It also can integrate the clinical neurochemist into the diagnostic process, if a good clinical question is provided with the analysis request. Above all, the laboratory is enabled to recognise analysis problems by inconsistent data combinations.
But: Knowledge-based data combinations are an aid to interpretation, but can never lead to a diagnosis on their own, which ultimately always has to be made by the doctor in the clinical context.
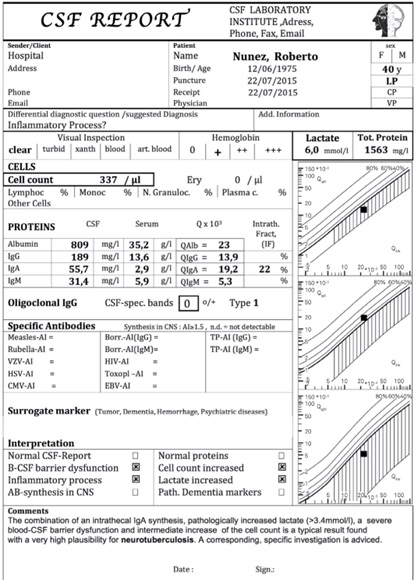
Example of the Cumulative CSF Report from a patient with Neurotuberculosis.
Ref.:Reiber H (2016). Cerebrospinal fluid data compilation and knowledge-based interpretation of bacterial, viral, parasitic, oncological, chronic inflammatory and demyelinating diseases: Diagnostic patterns not to be missed in Neurology and Psychiatry. Arq Neuropsiquiatr. 74:337-350
EQAS (External Quality Assessment System)
The Quality control of CSF Laboratory performance includes more then control of accuracy and variation of absolute concentrations of the proteins , lactate, glucose and dementia markers. As part of the control the participants have to interprete the combined data in quotient diagrams (IgG, IgA, IgM) and dementia marker combinations.
The uge variations of CSF/serum concentration quotients between the different methods in the surveys (INSTAND, Düsseldorf) indicate the necessity to control the suitability of the approach of the individual assay provider.
References
Reiber H (1995). External quality assessment in clinical neurochemistry: Survey of analysis for cerebrospinal fluid (CSF) proteins based on CSF/serum quotients. Clin Chem 41: 256-263.
Wildemann B, Oschmann P, Reiber H (2010) Laboratory diagnosis in Neurology Thieme Verlag, Stuttgart.
Reiber H (2024) Cerebrospinal fluid diagnostics in Neurology. Paradigm change in Brain Barriers, Immunology and Chronic Diseases (Springer)
Reiber H (2024) Disease-related data patterns in Cerebrospinal fluid diagnostics. Medical quality versus analytical quantity. Frontiers in Molecular Biosciences